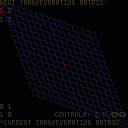
Linear Transformation Visualizer
This is a visualizer for matrix transformations on a 2D graph. Use z to apply your matrix, x to change indices, and the up/down arrow keys to adjust the value for that index. This is inspired by 3blue1brown's linear algebra videos.
Transformation matrixes that shrink a graph onto a line or the origin point can get strange on the visualizer. Adjusting the numbers and hitting z should reset everything. This was made for practice, so if there's anything else that glitches let me know!
Leave a comment
Log in with itch.io to leave a comment.